Analysis of Decision Support for Distributed Systems
written by
Francis Chan
In a distributed electronic design system, where tools, components and
services are distributed throughout the world, the need for an
understanding of the nature of relationships between components and
their use in particular designs, related services, and various users
or user groups, is essential. The needs can be satisfied by a
combination of tools in the area of:
Data Collection -- locating useful components and information
Data Mining -- capabilities of identifying and classifying various
forms of dynamic and static information about the objects and its
environment
Decision Support -- applications which help the user in
decision-making
Data Representation -- use and design of data forms
for efficient operation and user manipulation
Data Visualization -- displaying information in a way of
most use to the user
In this paper, we will briefly explore the concepts and significance
of each of the above areas and will look at research and
products wherever applicable. Through the investigation of existing
applications, we hope to either incorporate these tools into our
existing platform and future CAD program and/or learn about the
underlying techniques, requirements and essentials capabilities that
these tools possess in order to help us design and implement such
tools ourselves.
Data Collection
Data collection comprises the first stage of system analysis. It
starts with problem definition followed by the determination of the kind of
relevant data to gather for analysis. The suitable storage medium
(e.g. memory, text file, relational database entries, etc.) should also be
chosen to allow efficient browsing and manipulation of data.
The system designer must also determine the means and locations to
getting the required data, such as through textual research, customer
tracking data, web site hit sources and patterns, locations of web
objects, etc..
Data Mining
Data Mining is a process done by a user or a software program in
search for patterns of information in a database.
It may be done
reactively -- User Initiative, where the user thinks of a set of
specific questions to ask and patterns to look for, and then it's left
for the database to perform the relevant queries. Its shortcoming is
that it very difficult to think of all the relevant things to look at
and very often, important trends are being left unnoticed.
It can also
be done proactively -- System Initiative, where an intelligent
software, which may have an underlying engine using neural
networks, generates questions by itself, analyzes the database, and
looks for patterns without instructions by the user.
There is also a
Mixed-Initiative mode where the user and the system interact, with the
system providing some assistance, e.g. Multi-dimensional Analysis with
Corporate Vision; the user can look at the data from several
viewpoints, with suitable prompts from the system.
Data mining applications may also perform other activities:
Predictive Modeling: Patterns discovered from the database are used to
predict the future. Predictive modeling allows the user to submit
records with one or more unknown values while the system "predicts"
the unknowns based on previous patterns of the database.
Forensic Analysis: Extracted patterns are used to find anomalous, or
unusual data elements. To discover the unusual, the application first
finds what the norm is, then it detects the items that deviate from
the usual outside of a given threshold.
Data Mining and Intelligent Databases are now becoming a significant
market and areas of research. Some people have suggested that the
technology is in fact ahead of the application areas and that there is
a need for customization of current client base systems to provide
solutions within specific industries such as marketing, banking,
manufacturing, etc. Moreover, with the maturity of the technologies,
data mining
over the Internet can be made possible as there is also a growing demand for
Internet services in not just providing directory services of where
discrete information may be found but more in-depth
investigations of trends of users and transactions, which treats the
Internet as a large database.
A Data Mining Application: Information Discovery System IDIS
Information Discovery, Inc. is an innovative leader and provider of data
mining oriented decision support software and solutions, strategic
consulting, and warehouse architecture design.
It main product IDIS: The Information Discovery System has the following
characteristics:
Uncovers Patterns by Itself
Works on Many Computers and Databases
Generates Fully Readable English Text
Makes Predictions
Finds Errors and Anomalies
Works on Large Databases and Parallel Computers
Decision Support
Decision support systems (DSS) are computer based information systems
that are designed with the purpose of
improving the processes and outcomes of human decision making. Most
decision support systems are developed to
support an individual decision maker, such as a manager or an
engineer, but some are used by a number of decision makers to arrive at
a common decision (termed group decision support systems). An example
of a group decision support system is the executive information
systems (EIS), which gives many decision makers access to the same
information system and supports individual or discrete decisions.
A Decision Support Application: Runtime Design Automation VOV
VOV is a design flow manager which automatically captures and manages the
dependencies between the files generated during the
Computer Aided Design of complex systems, either hardware or software.
Most design management tools, such as CFI's Encapsulation Standard
(TES), emphasizes the control of the design activity by defining one
or few templates for each tool, in various forms, like makefile
templates, graphs, or rules. Many decisions about design flow and data
types as well as project structure have to be made
before the design starts. Not only are the preparation of these
templates time consuming, it is also difficult, if not impossible, to
represent all input/output dependencies of a tool using a template.
VOV, however, provides the designer with the flexibility of alternating
design methodologies while ensuring that tools are still called in the correct
order and that no data are accidentally lost.
Benefits that VOV presents to the user:
Automatic parallel retracing to regain consistency of data after one
or multiple changes
Documentation of design flow
Capability of determining effect of changes before making them
Management of computing resources such as computers and floating
licenses
Archival, retrieval of methodologies, usage and composition of
scripts and makefiles
Parallel execution of tools on the network
Intelligent tools, e.g. clevercopy which avoids re-compiling if
there are only changes in comments
Command line, menu driven and graphical Tcl/Tk user interfaces
Generic interface to databases. Included are UNIX, AR, OCT
Support of tools from Cadence, Exemplar Logic, Model Technology,
Synopsys, Vantage, Xilinx, UNIX utilities, C and C++ compilers
Multiple platform support, AIX, HP-UX, Linux, SunOS-4.x, Solaris-2, HAL

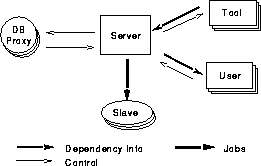
Block diagram of VOV architecture.
The client/server architecture of VOV supports concurrent activities,
team coordination, distributed data management, and distributed processing.
Server It manages the design trace. Depending on the operating
system, the server can handle up to 250 clients
simultaneously. There are four classes of clients:
Tools: connect to the server to declare their inputs and outputs, thus
allowing the server to build the design trace
Users: connect to the server to query and possibly modify the trace.
Slaves: offer computing resources to the server
Proxies: contribute knowledge about databases
Dependency graph
VOV uses a technique called run-time tracing, which is based on
the observation that only the tool knows accurately the dependencies
implied by its use. VOV offers two ways for tools to communicate the
dependency information at run-time:
Encapsulation:
consists normally of a shell script that computes the run-time
dependencies, communicates them to the
dependency manager, and then calls the tool. It is a powerful
technique that does not require any modification of the tool.
Integration:
An option for those who have access to the source code of the
tool; it is faster and easier than encapsulation. The
VOV Integration Library (VIL) consists of 600 lines of C code
distributed in source format.
(The integration library is passive if VOV is not running; the
integrated tool behaves exactly as the original tool.)
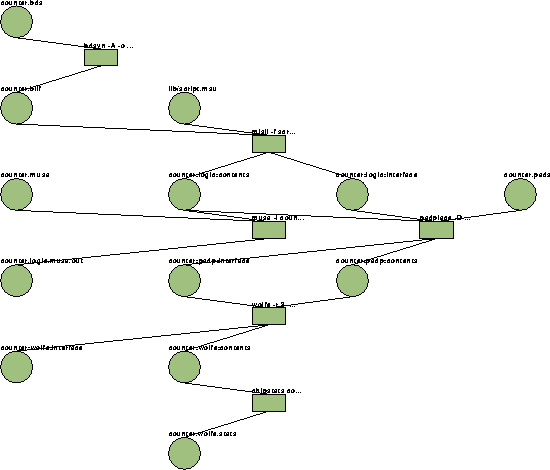
The information produced by the tools is used by the VOV server to
build the dependency graph, also called the design trace.

A design flow graph.

A design trace which shows the dependencies between 1948 files and 835
tool invocations required to produce the Linux and IBM-AIX version of
VOV.
Data Representation
Data representation is the abstraction of the concept to be
represented. The choice of data structures (at the system level) for
representation is very important as it dictates how the system level
interacts with the user interface. A good representation should
possess the following qualities:
Efficiency: the representation (e.g. b+tree, database) should be
chosen such that accesses and queries can be done efficiently.
Flexibility/Portability: an abstraction should be general enough to
allow extensive use in different parts of a model and in different
kinds of models.
Clarity: a representation should bear a clear and well-defined
relationship to the object representing.
Transparency: both designers and end-users should be able
to understand the model without being aware of the level of
abstraction of a particular object.
Data Visualization
Computer-Aided Visualization can be divided into two categories:
scientific visualization and intuitive data visualization.
Scientific Visualization strives to convert large data sets into
comprehensible pictures. Data sets generated by modern instruments and
supercomputers can be so large that visualization is essential to
comprehension. The results may require detailed examination by the
engineer or scientist of the data as the results might not be
obvious to a general audience. Scientific visualization usually
involves a great deal of numerical programming: vector arithmetic,
inverting matrices, solving ODE's, etc.
Intuitive Data Visualization is concerned with gaining insight and
understanding through visual interpretations of complicated data
structures. Its goal is to explain or promote easily understood and
comprehended results to a wide audience. Intuitive data visualization
is an evolving technology which provides technical innovations that present
data in unique and nontraditional ways. Data types, formats and
techniques applied include, but is not limited to, multi-dimensional
descriptions and animated depictions. Though visualizations are
frequently a result of gridded numerical computations, non-geometric
calculations and experimental data can also produce animations
involving data. While still images and interactive data exploration
remain as powerful visualization options, video animation is emerging
as a popular way to illustrate concepts.
Useful properties of a user interface for data visualization
include:
User Manipulation and Editing
Multi-user Support
Network Connectivity
Interactivity
Examples of current data visualization applications:
Advanced Visual Systems (AVS)
IBM Visualization Data Explorer (DX)
IRIS Explorer
Reference Papers:
On VOV
[1] Andrea Casotto and Alberto Sangiovanni-Vincentelli. "Automated
design management using traces." IEEE Transactions on CAD, August 1993.
On Data Mining
Intelligent Database Tools and Applications, New York: John Wiley and
Sons, 1993 .
The Four Spaces of Decision Support, DBMS Magazine, November 1995.
The Sandwich Paradigm, Database Programming and Design, April 1995.
What Can IDIS Do That Statistics Cannot?, Information Discovery, Inc., 1995.
Large Scale Data Mining in Parallel, DBMS Magazine, February 1995.
Concentric Design for Decision Support, Database Programming & Design,
May 1993.
Information made Visual using HyperData, AI Expert, September, 1992.
Quality Unbound, Database Programming and Design, November 1994.
On Intelligent CAD
Holden, T. The Application of Knowledge-based Systems to
Microelectronic CAD (Doctoral Thesis). London University, 1985.
Holden, T. Knowledge-based CAD and Microelectronics (book). Elsevier
North-Holland, 1987.
Holden, T. Decision Support for Creative Design. Workshop on the
Representation of Design in CAD. Centre for
Configurational Studies, Open University, Milton Keynes, UK, 7-8 May 1987.
Holden, T., Flynn, M., Patel, M. A Hardware Synthesis
Methodology. Alvey CAD037 project report, Sept 1987.
Patel, M., Flynn, M., Holden, T. VLSI Design by Intelligent
Transformation of Specification. Electronic Design Automation Conference, 1987.
Brumfit, J., Flynn, M., Patel, M., Holden, T. A Hardware Synthesis
Methodology. IEE Design Synthesis Conference, 1988.
Holden, T. An Intelligent Assistant for the Interactive Design of
Complex VLSI Systems. In Yoshikawa, H., Holden, T.,
Intelligent CAD: Proceedings of the IFIP Second Workshop on
Intelligent CAD, Sept 1988. Elsevier North-Holland.
Holden, T. Overview of Intelligent CAD Issues. Intelligent CAD:
Proceedings of the IFIP Second Workshop on
Intelligent CAD, Sept 1988. Elsevier North-Holland.
Yoshikawa, H., Holden, T. Intelligent CAD, Proceedings of the IFIP
Workshop on Intelligent CAD, 1990. Elsevier
North-Holland.
Holden, T. Frameworks for Design using Artificial Intelligence
Techniques. IFIP TC5/WG5.2 Third International
Workshop on CAD, Osaka, Japan, 26-29 Sept 1989.
Green, I., Holden, T. A Transformational Programming Assistant. In
Yoshikawa, H. and Arbab, F., editors, Intelligent
CAD III, Procedings of the IFIP TC5/WG5.2 Third International Workshop
on CAD, Osaka, Japan, 26-29 Sept 1989,
pp129-141. North-Holland, 1991.
Back to Index
Modified: February 23, 1995
Feedback: Francis Chan
(fchan@ic.eecs.berkeley.edu)


