|
Authors
Edward A. Lee
Christopher Brooks
Contributors
Lukito Muliadi
William Wu
Jun Wu
|
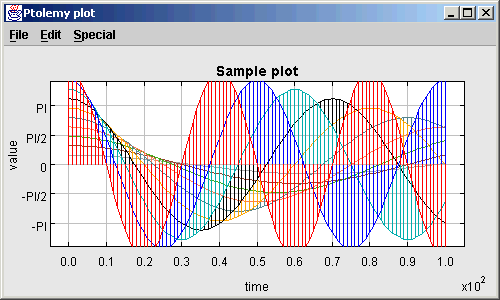
Ptplot is a set of two dimensional signal plotters components
written in Java with the following properties:
- Embeddable in applets or applications.
- Auto-ranging.
- Automatic or manual labeling of axes.
- Automatic or manual tick marks.
- Logarithmic axes.
- Live, animated plots.
- Infinite zooming.
- Various plot styles: connected lines, scatter plot, bars, etc.
- Various point styles: none, dots, points, and unique marks.
- Multiple data sets and a legend.
- Color or black and white plotting.
- Error bars.
- Editable plots.
- PlotML, and XML language for specifying plots.
- Compatibility with pxgraph, an older plotting program.
There is a set of
demonstrations
of the various capabilities.
There are several ways to use the classes in the plot package.
- You can invoke an executable, ptplot, which is a shell script,
to plot data on the local file system or on the network.
- You can invoke an executable, pxgraph, which is a shell script,
to plot data that is stored in binary format compatible with the
older program pxgraph.
- You can invoke a Java application, such as PlotMLApplication,
by setting your CLASSPATH variable appropriately and using the
java executable that is included in your Java
distribution.
- You can reference an existing applet class, such as PlotMLApplet,
in an HTML file. The
applet parameters, such as dataurl, give the plot
data and format information, either by referring to another
file on the network, or by directly including the information.
You do not even have to have Ptplot installed on your server,
since you can always reference the Berkeley installation.
- You can create new classes derived from applet, frame, or
application classes to customize your plots. This allows you
to completely control the placement of plots on the screen,
and to write Java code that defines the data to be plotted.
The plot data can be specified in any of three data formats:
- PlotML is an XML extension for plot data. Its syntax is similar
to that of HTML.
- An older, simpler syntax for plot data is also provided, although
in the long term, that syntax is unlikely to be maintained (it will
not necessarily be expanded to include new features). For simple
data plots, however, it is adequate. Using it for applets has the
advantage of making it possible to reference a slightly smaller
jar file containing the code, which makes for more responsive applets.
- A binary file format used by the popular pxgraph program, an
extension of xgraph, is supported by classes in the compat
package. There is also a shell script, called pxgraph, which
invokes these classes. Formatting information in pxgraph
(and in the compat package) is provided by command-line arguments,
rather than being included with the plot data, exactly as in the
older program. Applets specify these command-line arguments
as an applet parameter.
The main class implementing the plotter component is
Plot.
It is derived from
PlotBox,
which provides only the axes and
decorations of the plot. This is implemented in a base class so that
it can be reused for different kinds of plots. Live (animated) data
plots are supported by the
PlotLive class.
This class is abstract; a derived class must be created to generate
the data to plot (or collect it from some other application).
Editable plots (where a user can interactively modify the data being
plotted) are supported by the
EditablePlot
class.
The above classes define panels that are used by placing them
into a user interface context such as an applet or the top-level window
of an application. A number of classes are provided to support common
situations, but you should keep in mind that these classes are by
no means comprehensive. Many interesting uses of the plot package
involve writing Java code to create customized user interfaces
that include one or more plots.
The most commonly used built-in classes are those in the plotml
package, which can read PlotML files and the older textual syntax.
These classes are include:
- PlotMLApplet: A simple applet that can read PlotML files off the web and
render them.
- EditablePlotMLApplet: A version that allows editing of any data set in the
plot.
- PlotMLFrame: A top-level window containing a plot defined by a PlotML file.
- PlotMLApplication: An application that can be invoked from the command line
and reads PlotML files.
- EditablePlotMLApplication: An extension that allows editing of any data
set in the plot.
The last of these is the class invoked by the ptplot command-line script.
It can open plot files, edit them, print them, and save them. There are simpler
version of some of these in the plot package that cannot read PlotML
files, but can read an older, simpler syntax. The only reason to use these simpler
versions is for the slightly smaller jar file sizes, which can improve the responsivity
of applets.
TwoPlotExample is a very simple sample
Ptplot application that uses only core classes in the plot package, and
exercises complete control over the layout of the page.
Backward compatibility with the C pxgraph program is provided
in the compat package by the PxgraphApplet
and PxgraphApplication classes
in the compat package.
This code owes a heavy debt to David
Harrison, the original author of xgraph, which runs under
the X window system on Unix platforms. An extension to
xgraph called pxgraph, written by Joe Buck,
reads binary files as well as ASCII. For compatibility with these
programs, we have provided a Bourne Shell script called
pxgraph that is a drop-in replacement for either
xgraph or pxgraph. Unlike the original
program, however, the Java implementation does not depend on the X
window system. We have provided a DOS batch file called
pxgraph.bat that brings pxgraph capability
to Windows platforms.
Last Updated: $Date: 2010-10-05 18:29:54 -0700 (Tue, 05 Oct 2010) $

