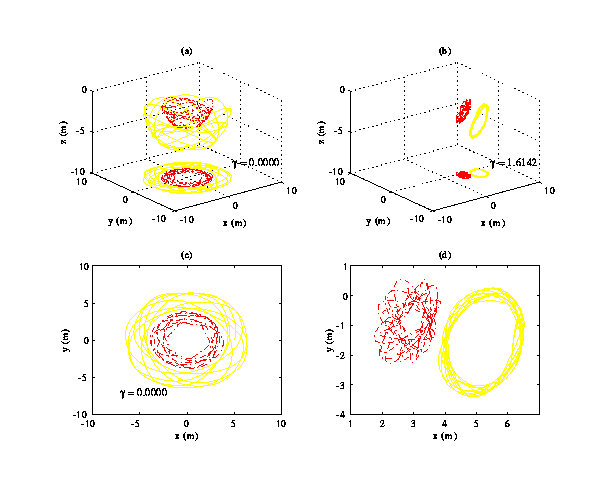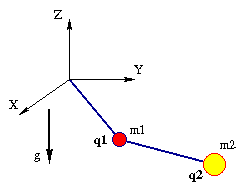

Initial conditions were chosen and the DSP was simulated over time. The results were then transformed to a moving frame to discover patterns in the data. In Figure 1 (a) and (c), the trace of the two masses over time in the inertial frame are shown. The red bob and the yellow bob spiral about the vertical axis. The trace of the two masses as seen in a frame rotating with critical angular velocity about the Z-axis is shown in Figure 1 (b) and (d). The constant angular velocity is indicated in Figure 1 (b). The motion of the bobs viewed in the critical frame appears to move about two small circles.

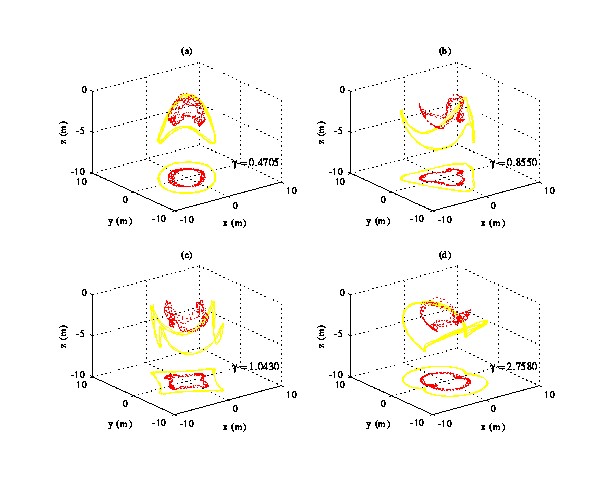
Patterns for other angular velocities of the viewing frame are shown
in Figure 2 (a)-(d). The original complicated trace in Figure 2 (a) is
transformed into four patterns shown in this Figure. An oval appears
in Figure 2 (a), a triangle appears in Figure 1 (b), a square appears
in Figure 2 (c), and a pattern with a reflection symmetry is shown in
Figure 2 (d).

More details are found in my masters thesis in a Center for Pure and Applied Mathematics (CPAM) memo (CPAM-656, November 1995, 557KB) and in an ICIAM conference paper, Marsden, Scheurle, and Wendlandt 1995, 328KB.
A movie of pattern evocation in the DSP is shown here (2.2MB). The angular velocity of the viewing frame is changed in each frame.