


Look inside to see:
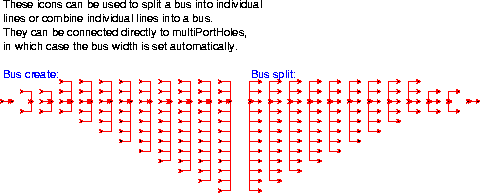
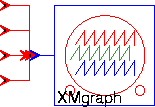
These icons permit you to break out a block with a generic "multi-input" into some specific number of identifiable inputs. To use them, place a dot on a terminal with a double arrow icon, place the cursor over the desired icon in the above palette (the one with the appropriate number of inputs), and type "c". Thus, for example, the SDF XMgraph block can be set up to accept four inputs signals as follows:
These icons are examples of "higher-order functions" in Ptolemy, explained in a later chapter.
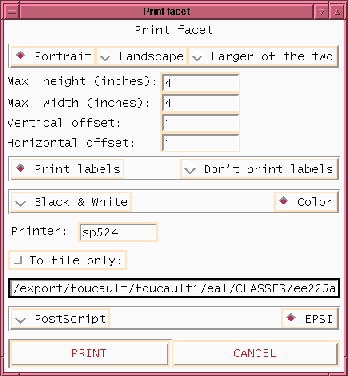
There are a number of options. If you have a postscript printer, you can print directly to the printer. If you have the program ps2epsi in your path (part of the ghostscript distribution, available on the software warehouse), then you can print to an encapsulated postscript file, which can then be imported into many word processors. The figures in this document were created this way, by importing epsi or postscript into FrameMaker. If you have neither a postscript printer nor ps2epsi, you can use an X window dump. The program xwd will create a file that may be importable into various programs (such as drawing programs). If you must use xwd, you should start pigi (or ptiny) with the -bw option to get a white background.
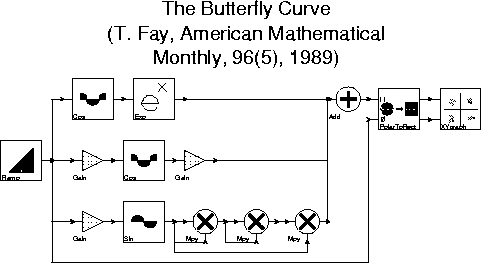
You should show on your schematics any parameter values that differ from the defaults. For lab reports, it may be easiest to just write on your printout, annotating it with comments and parameter values. Alternatively, you can enter text directly onto the schematic using the "edit-Label" command (place a point and type "E"). Below is an example of a well-annotated schematic:
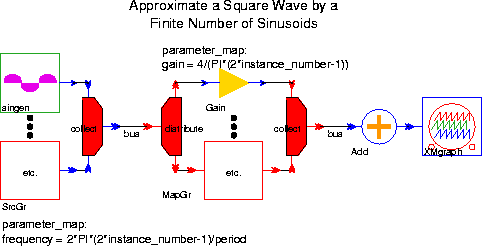
More information about labeling is given below.
You can also include a PostScript file in a FrameMaker document. Encapsulated postscript can be imported directly. Alternatively, an ordinary postscript file can be included. First, create a disconnected text column using the graphics tools. Then, put in the text box a
#include line. For example, the text box might contain the following line:
It is possible, instead of using the
#include line as above, to directly import the PostScript file into FrameMaker. However, this makes the text document very large, and the FrameMaker process appears to grow in size uncontrollably. Unfortunately, as of this writing, it does not appear possible to convert these PostScript files to encapsulated PostScript, which would have the advantage of displaying a semblance of the image.
fmcolor and the Poskanzer Bitmap (PBM) tools to reduce a color window dump to a black and white window dump. This will save space and avoid any dithered imitations of color. However, since fmcolor applies a threshold based on color intensity to the image, some foreground colors may get mapped to white instead of black. To prevent this, use the -cp (cp stands for color printer) command line option when starting pigi, as in
pigi before capturing the image, and then to use the document editor itself to annotate the image. The fonts then will be printer fonts rather than screen fonts. To turn off the labels, execute the vem command "layer-display" under the vem "Options" menu.


