

pt_ifstream and
pt_ofstream, which are derived from the standard C++ stream classes
ifstream and
ofstream, respectively. More sophisticated output can be obtained with the XGraph class, the histogram classes, and classes that interface to Tk for generating animated, interactive displays. All of these classes are summarized in this section.
pt_ofstream class is used in the Printer star on
page 2-28. Include the header file pt_fstream.h. The pt_ofstream constructor is invoked in the setup method with the call to new. It would not do to invoke it in the constructor for the star, since the fileName state would not have been initialized. Notice that the setup method reclaims the memory allocated in previous runs (or previous invocations of the setup method) before creating a new pt_ofstream object. Notice that we are not using a wrapup method to reclaim the memory, since this method is not invoked if an error occurs during a run. open method. These file names are <
cin>, <
cout>, <
cerr>, or <
clog> (the angle brackets must be part of the string), then the corresponding standard stream of the same name is used for input (pt_ifstream) or output (pt_ofstream). In addition, C standard I/O fans can specify <
stdin>, <
stdout>, or <
stderr>.
expandPathName (see table
3-7 on
page 3-8) is applied to the filename before it is opened, permitting it to start with ~user or $VAR.
Error::abortRun is called with an appropriate error message, including the Unix error condition.
These classes can be used for binary character data as well as ASCII.
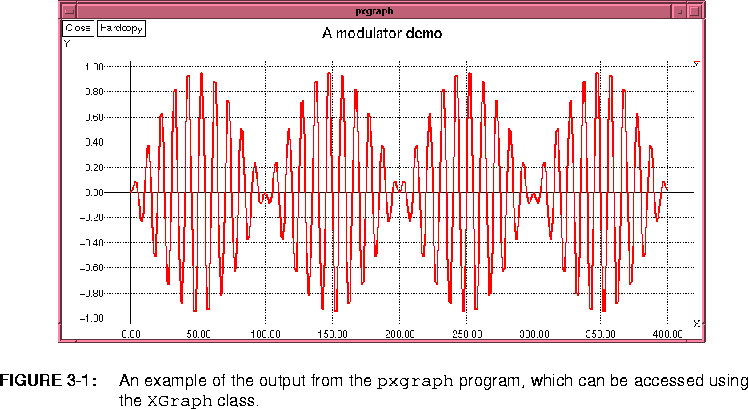
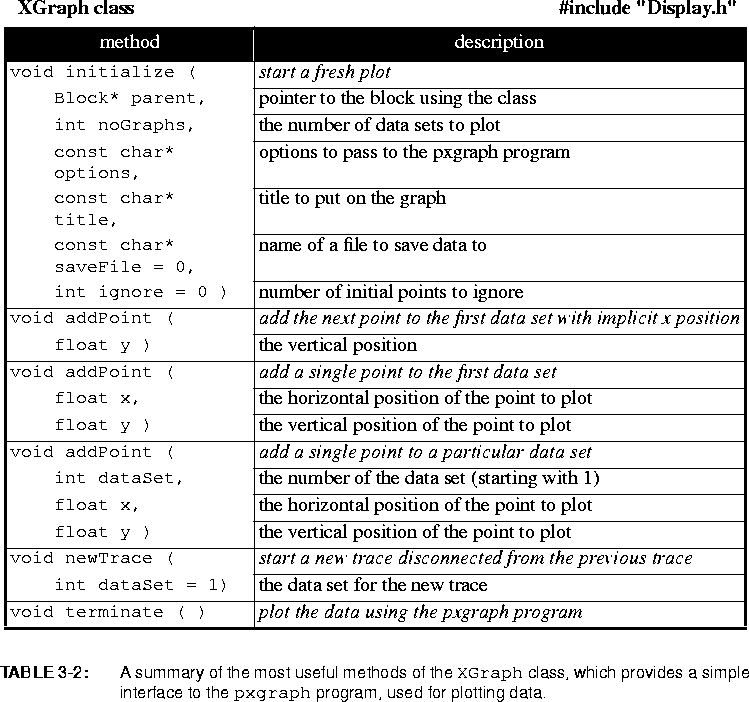
XGraph class provides an interface to the
pxgraph program, used for
plotting data on an
X window system display. The pxgraph program and all its options are documented in the User's Manual. An example of the output from pxgraph is shown in figure
3-1
BarGraph class creates a
Tk window that displays a bar graph that can be modified dynamically, while a simulation runs. An example with 12 data sets and 8 bars per data set is shown in figure 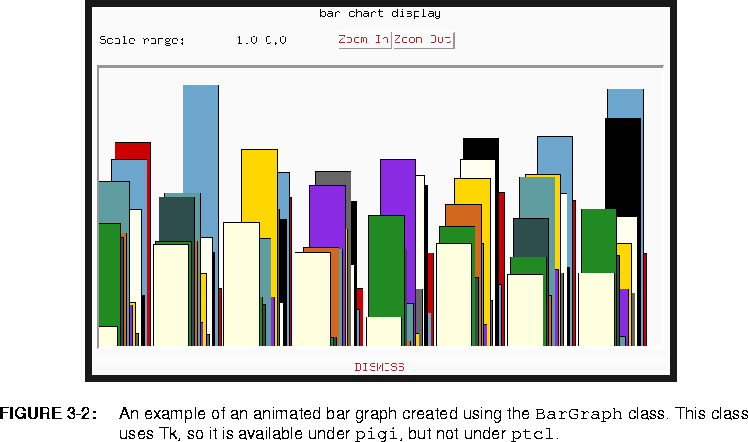
pigi process, not to stars linked into the interpreter,
ptcl. The reason for this is that ptcl does not have the Tk code linked into it. Correspondingly, the class definition source code is in $PTOLEMY/src/pigilib, rather than the more usual $PTOLEMY/src/kernel.
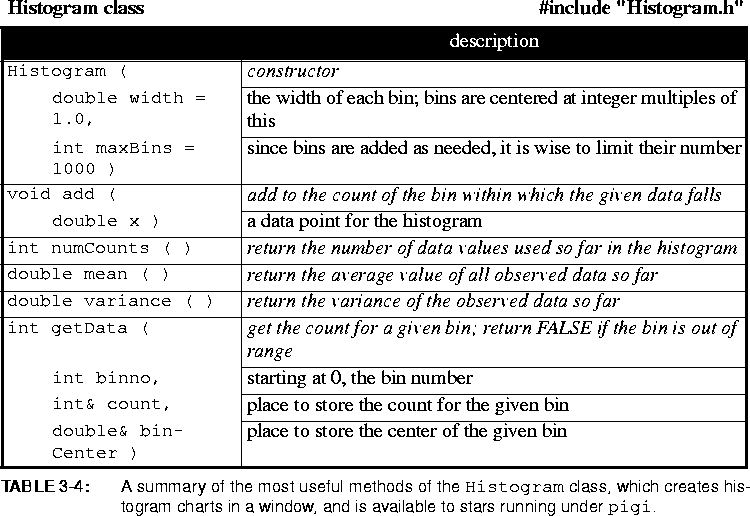
Histogram class constructs a histogram of data supplied. The
XHistogram class also constructs a histogram, but then plots it using the
pxgraph program. An example of such a plot is shown in figure
3-3. 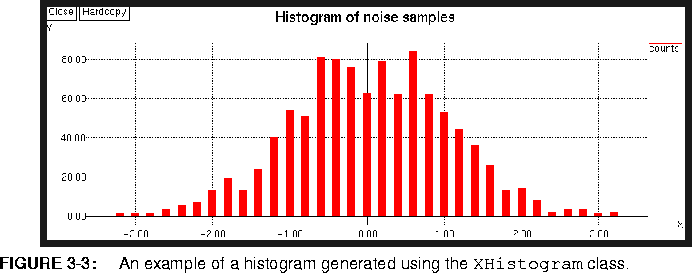


Copyright © 1990-1997, University of California. All rights reserved.