


cp -r (see the section below,
"Copying objects" on page 2-44). You can modify the copied version.cd $PTOLEMY/demoStart the Ptolemy graphical interface:
pigi &You should get three windows: a
vem console window at the upper left of your screen, a palette with icons of demonstrations below that, and a message window identifying the version of Ptolemy, as shown in figure 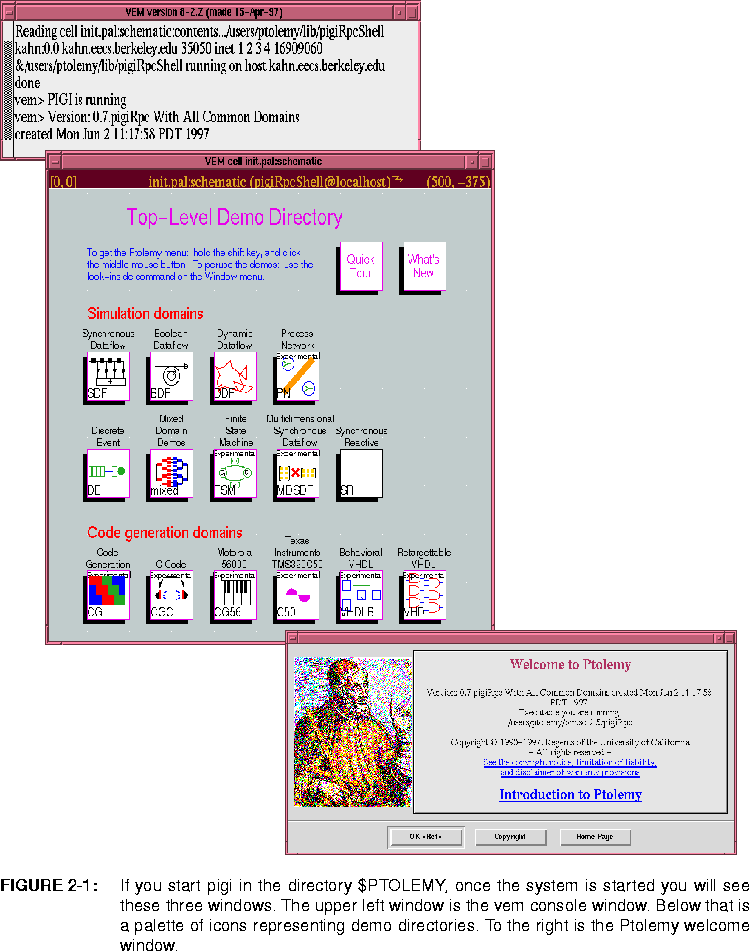
pigi -ptiny &Once you get all three windows, you have started two processes: the graphical editor,
vem, and a process named pigiRpc that contains the pigi code and the Ptolemy kernel. The vem window prints the textual commands corresponding to your selections with the mouse. Watching the vem window is useful in diagnosing mistakes, such as drawing a box when you meant to draw a line. The vem console window also displays debugging messages, as well as the error and warning messages that appear in popup windows.
Clicking any mouse button in the welcome window (the one with the picture of Mr. Ptolemy) will dismiss it. Clicking the left mouse button on the "more information" button will display copyright information. The remaining windows can be moved and resized using whatever mechanism your window manager supports. The windows can be closed by typing a control-d with the mouse cursor inside the window. Closing the vem console window will terminate the entire program.
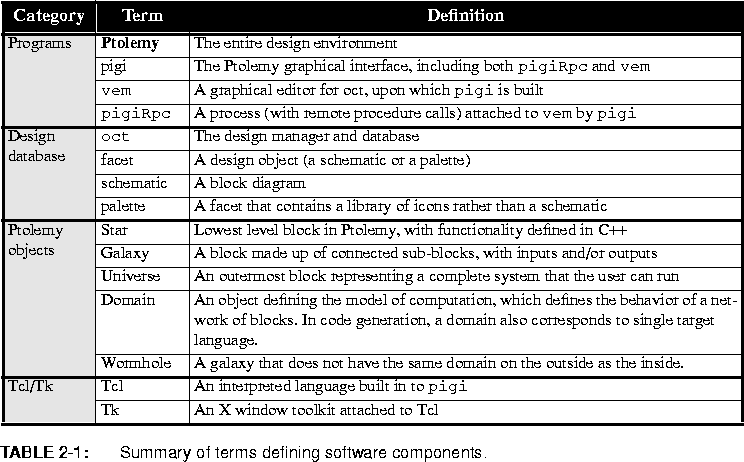
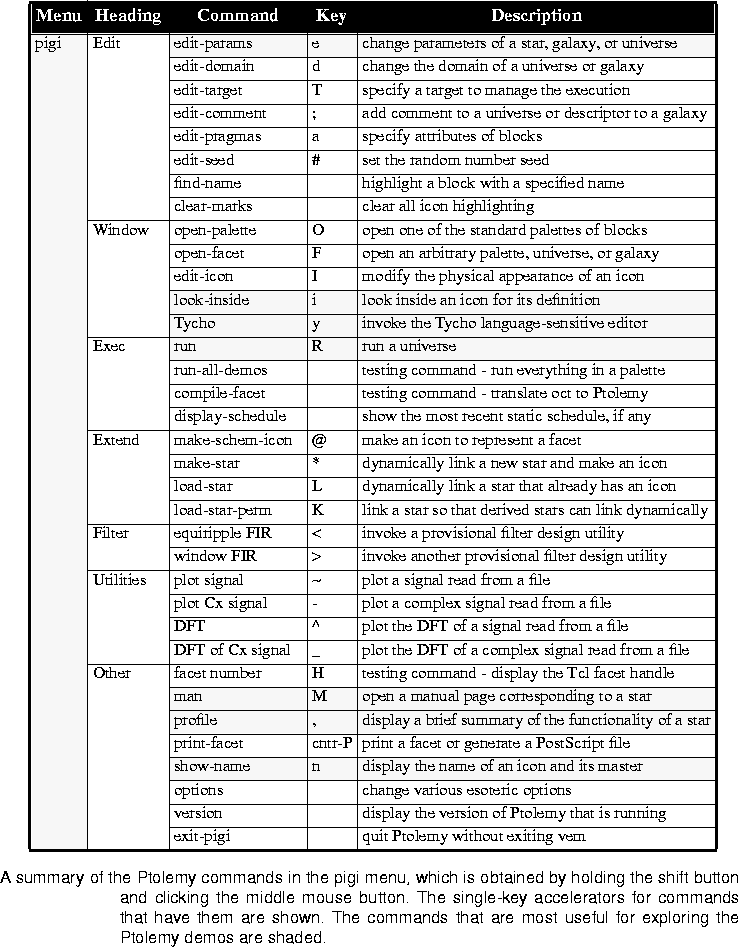
For reference, a summary of the pertinent terms is given in table 2-1 on page 2-4.
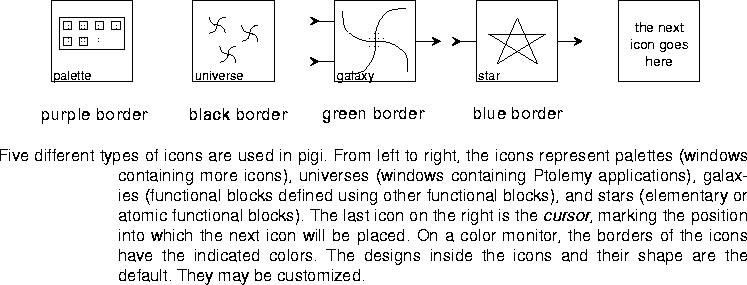
The palette window contains icons. Five different types of icons are used in pigi, as shown in figure
2-2
pigi command menu by holding the shift key and clicking the middle mouse button. This style of menu is called a "walking menu." Make sure you hold the shift button. The resulting command menu is shown below:
Note in the Ptolemy menu that the look-inside directive has an "i" next to it. This is a "single key accelerator." Without using the walking menu, you can look inside any icon by simply placing the mouse cursor and hitting the "i" key on the keyboard. The single-key accelerators are extremely useful. In time, you will find that you use the menu only for commands that have no accelerator, or for which you cannot remember the accelerator. The Ptolemy commands obtained through the above menu are summarized in table 2-2.
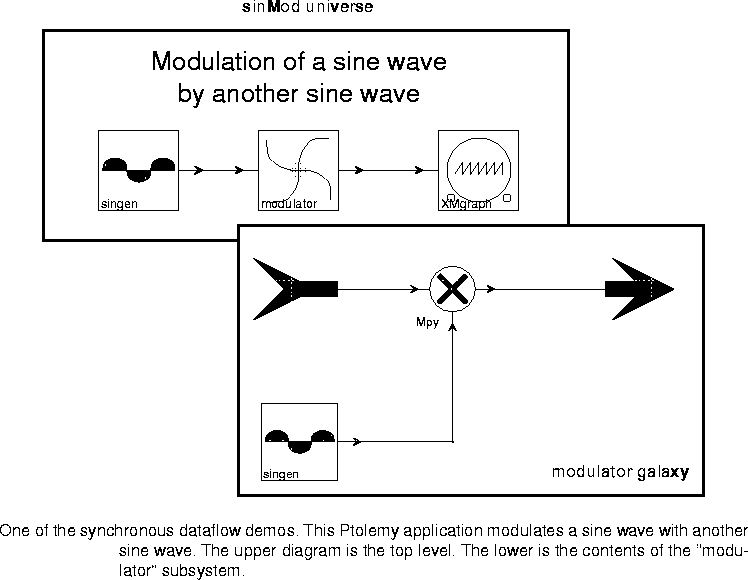
Look inside the first demo on the third row, labeled "sinMod". You will see the schematic shown in figure
2-4.
PT_DISPLAY (see
"Environment variables" on page 2-51).sinMod system using the walking menu, place the mouse cursor anywhere in the window containing the sinMod schematic, i.e., your cursor should be in the window that contains the following schematic: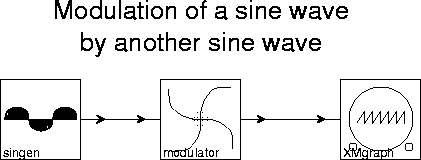

If you click the left mouse button on the "GO" button (or hit "return"), Ptolemy will run this application through 400 iterations. When the run is finished, a graph appears, as shown in figure 2-5.
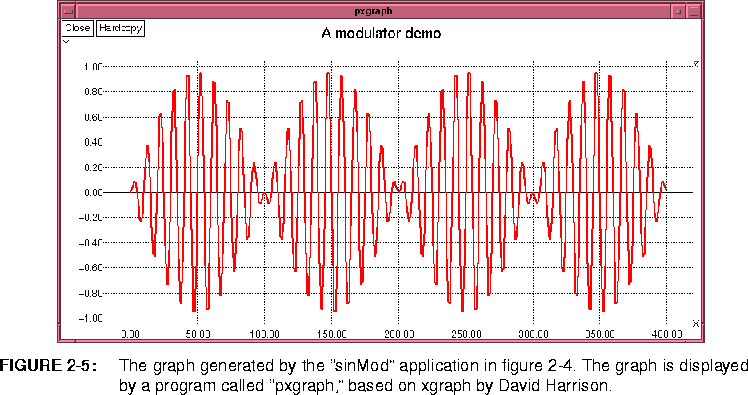
pxgraph window by drawing boxes; to draw a box, just drag any mouse button. This causes a new window to open with a display of only the area that your box enclosed. Although the new window covers the old, if you move it out of the way, you can see both at once. Any of the now numerous open windows can be closed with a control-d.vem command menu, which is different from the pigi command menu, appears. This menu is the same style of "walking menu" as the pigi menu, and is shown below: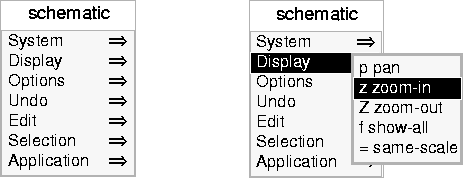
The vem menu is used for manipulating the graphical description of an application. The commands obtained through this menu are summarized in table
2-3, and explained in full detail in
Chapter 19.
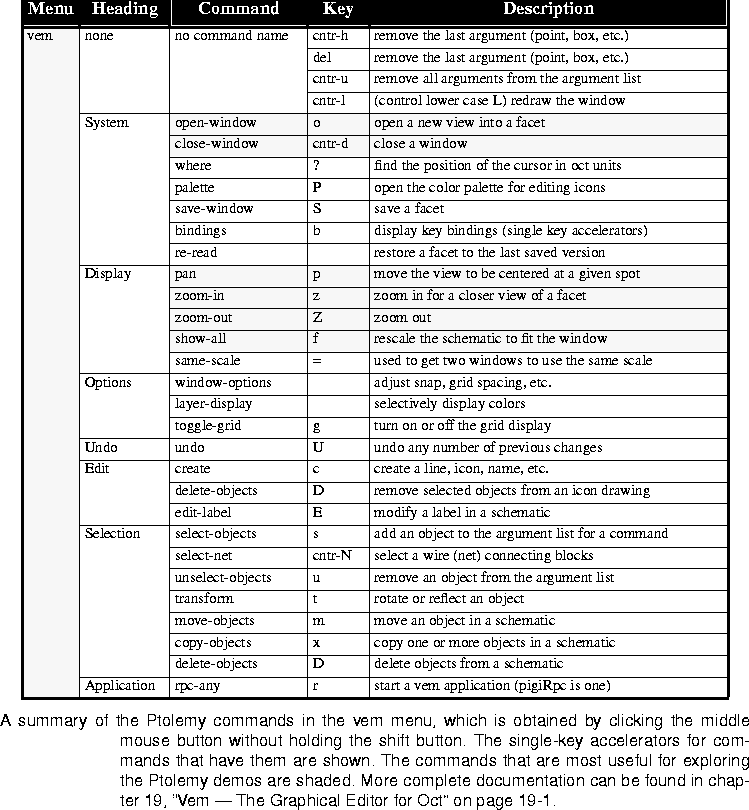
A few additional window manipulations will prove useful almost immediately. In any of the vem windows, you can closely examine any part of the window by drawing a box enclosing the area of interest and typing an "o". Like in a pxgraph window, this causes a newwindow to open, showing only the enclosed area. Unlike pxgraph windows, typing the "o" is necessary. In addition, you can enlarge a window using your window manager manipulation, and type an "f" to fill the window with the schematic. You can also zoom-in (or magnify) by typing a "z", and zoom-out by typing a "Z" (see table
2-3 on page 2-11). These and other vem commands are referenced again later, and documented completely in chapter
19.
sinMod example works. There are several clues to the functionality of the stars. After a while, the icons themselves will be all you will need. At this point, you can get several levels of detail about them. First, you will want to know the name of each star. If you have closed the sinMod window, open it again. Notice the names that appear on each of the icons. In more complicated schematics, when the icons are much smaller, the names will not show. You can zoom-in on a region of the window to see the names. Alternatively, you can place the mouse on any icon and issue the "show-name" command (in the "Other" menu), or type "n".
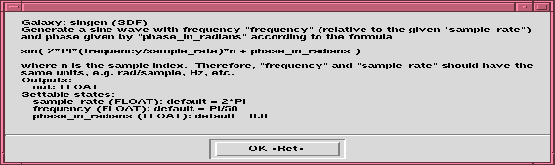
Find the singen block at the left of the sinMod schematic. To understand its function, place the mouse cursor on it, and execute the Other:profile command. Here "Other" refers to the command category and "profile" to the command in the submenu (you may also type ","). This command invokes a window that summarizes the behavior of the block, as shown below:
For some blocks, further information can be obtained with the Other:man1 ("M") command, which displays a formatted manual page. Try it on the XMgraph block at the right of the schematic. The ultimate documentation for any block is, of course, its source code. For the singen block, the source is another schematic. Use the "look-inside" command (using the accelerator key "i") to see it. Recall that you can also look at the source code of the lowest level blocks (called stars) by looking inside them.
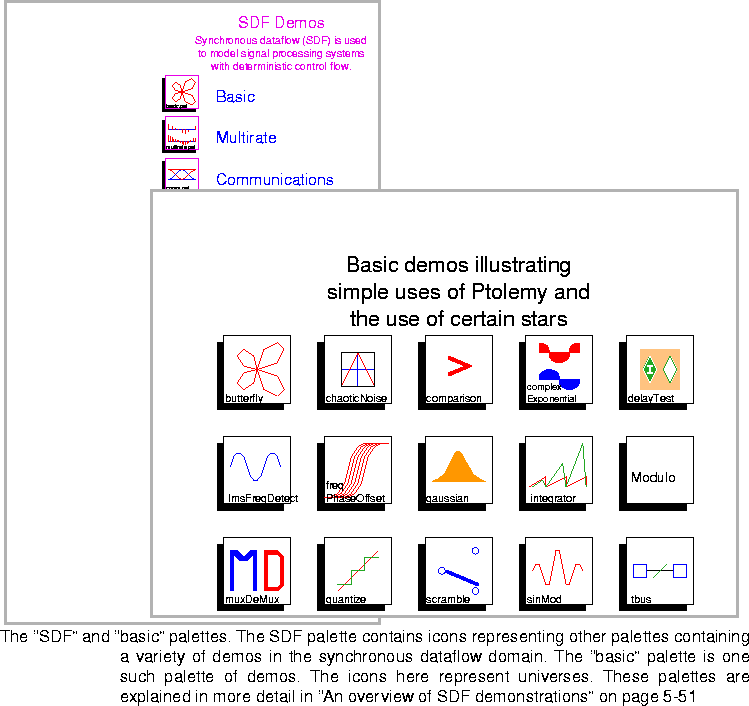
butterfly demo at the upper left of the "basic" palette in figure
2-3 is particularly worthwhile. The demos in this and other palettes are briefly summarized in
"An overview of SDF demonstrations" on page 5-51.
The init.pal palette in figure
2-1 contains icons leading to a top-level demo directory for each domain distributed with Ptolemy. Some of these are labeled "experimental". These domains largely reflect research in progress and should be viewed as concept demonstrations only. The mature domains have no such label, although even these domains contain some experimental work. A quick tour of the basic capabilities can be had by looking inside the icon labeled "quick tour" in the start-up palette shown in figure
2-1. Each time you encounter a universe, run it.
init.pal palette in figure
2-1 leads to such a tour. Look inside it and you will see an icon for each of the last several releases. Open any one and explore the icons therein. Each time you encounter a universe, feel free to run it.
ptlang program. Copyright © 1990-1997, University of California. All rights reserved.