Finding the Frequency Response Using Matlab
The frequency response of our Chebyshev filter is given by
This form of the frequency response is difficult to comprehend
analytically. However, you can get insight into the behavior of
the filter by plotting it using Matlab. The easiest way to do
this is to use the freqz function. Here is, verbatim,
the help information on this function:
» help freqz

 FREQZ Z-transform digital filter frequency response.
    When N is an integer, [H,W] = FREQZ(B,A,N) returns the N-point frequency
    vector W in radians and the N-point complex frequency response vector H
    of the filter B/A:
                jw              -jw               -jnbw
         jw  B(e)   b(1) + b(2)e + .... + b(nb+1)e
      H(e) = ---- = ----------------------------
                jw              -jw               -jnaw
             A(e)   a(1) + a(2)e + .... + a(na+1)e
    given numerator and denominator coefficients in vectors B and A.
    ...
    If N isn't specified, it defaults to 512.
    ...
    FREQZ(B,A,...) with no output arguments plots the magnitude and
    unwrapped phase of B/A in the current figure window.
    ...
Although this purports to talk about a Z transform, in fact it is giving a Fourier transform (of the impulse response), not a Z transform, so you do not need to know anything about Z transforms to use it. This function is part of the signal processing toolkit.
For our filter design,
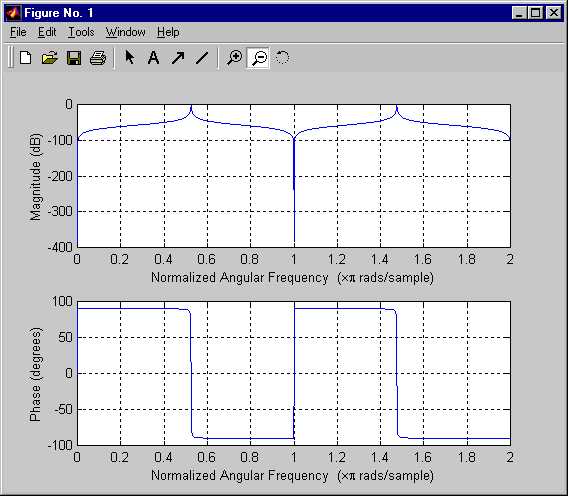
freqz([0.0027, 0.0, -0.0027],[1.0, 0.1569, 0.9995]);
yields the following plot:

Notice that the magnitude frequency response is given in decibels.

 Up to Topics
 Previous
 Next
Next