Evaluating Filter Quality
Consider the plot below comparing three filters:
The differences between these filters are mainly in their stopband attenuation. Comparing filters in the stopband can be difficult because the gain in the stopband is typically very small compared to the gain in the passband. The comparison is easier to make if the frequency response is plotted using a logarithmic scale.
It is customary in electrical engineering to use decibels to get a logarithmic scale. Given a gain G, which is unitless (it is the ratio of two magnitudes with the same units), we can express it in decibels as
This has units of decibels, written dB. The same frequency response as above is given below in decibels:
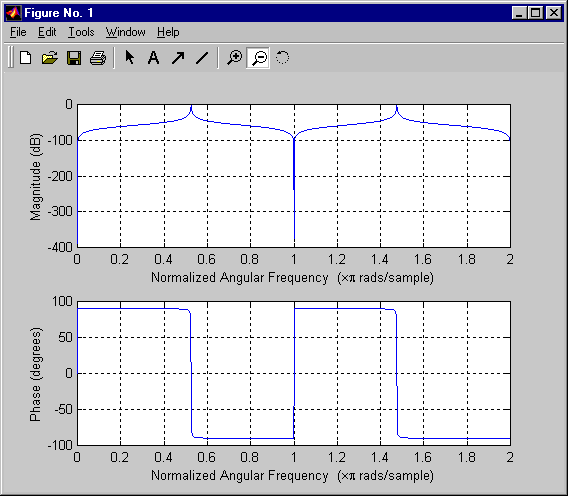
Notice that the Matlab freqz function gives the
frequency response in decibels:


 Up to Topics
 Previous
 Next
Next